This project is partially supported by financial contributions from Fisheries and Oceans Canada. It is also funded in part by RBC Foundation.
About the app
Anyone can contribute to the national record.
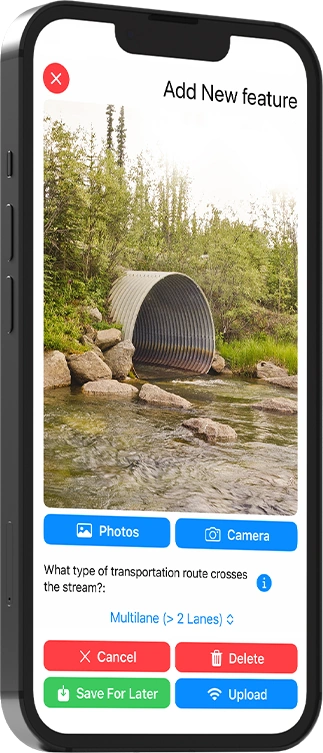
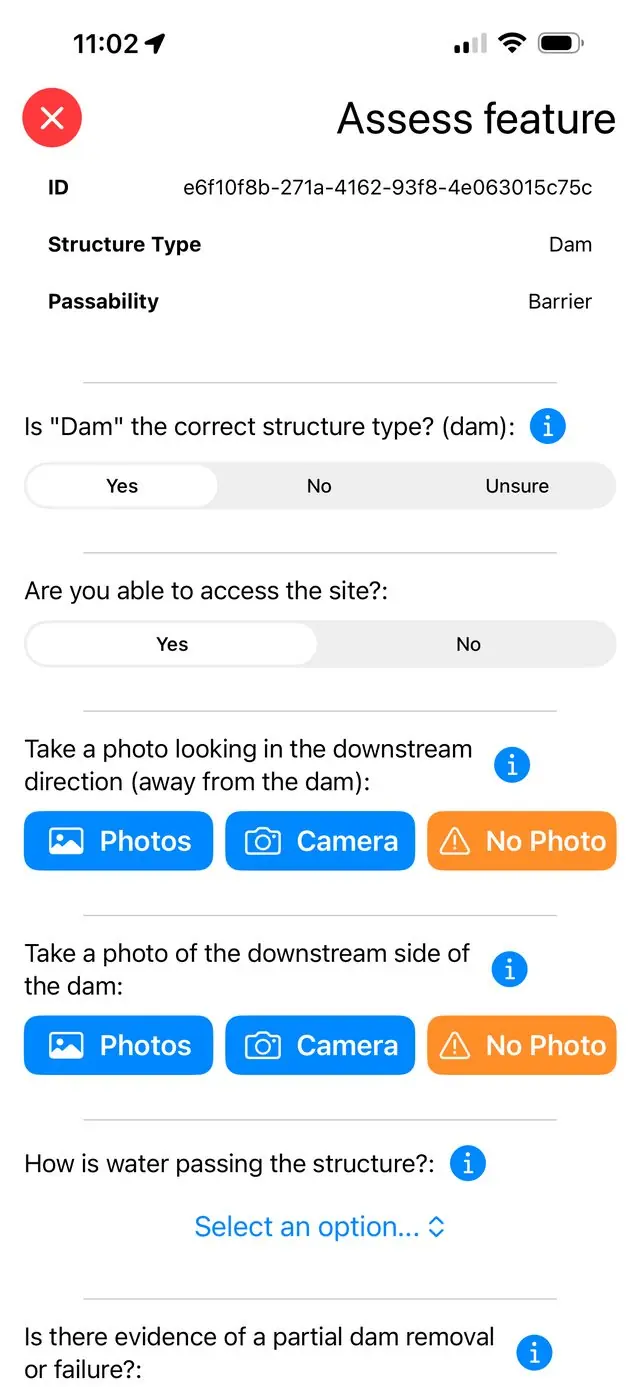
The Canadian Fish Passage Assessment app (CANFISHPASS) turns everyone into a community scientist. Visit the location of a potential aquatic barrier, answer a few simple questions, take a photo and the app records the location automatically.
No specialized training or equipment is required. Just a smartphone and a bit of curiosity.
01
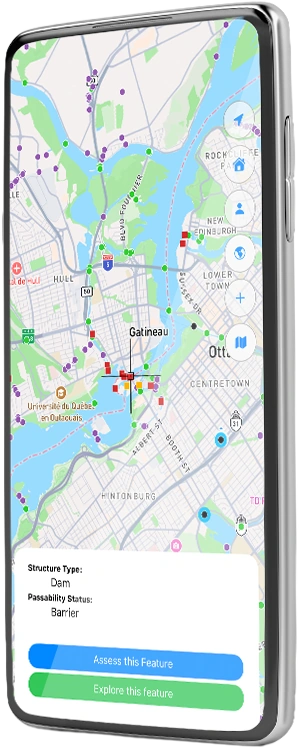
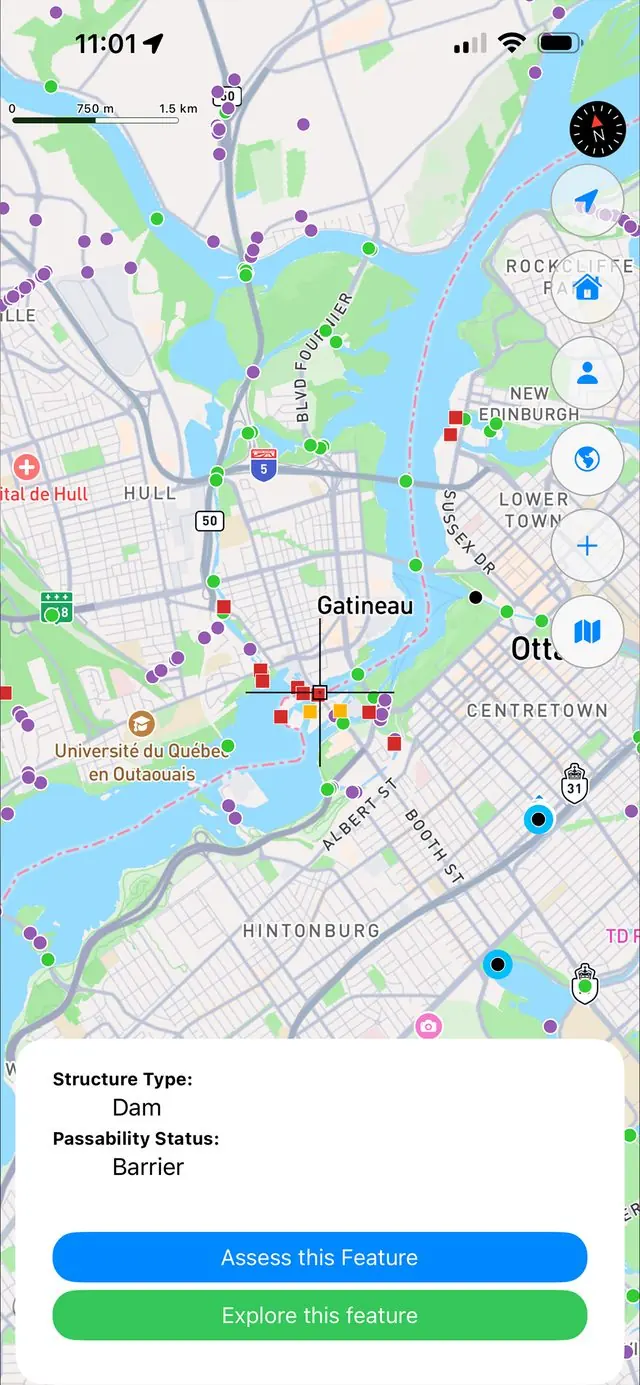
See what’s mapped.
Open the app and check what’s already recorded near you.
02
Answer a few questions.
Simple, plain-language prompts about the structure.
03
Upload.
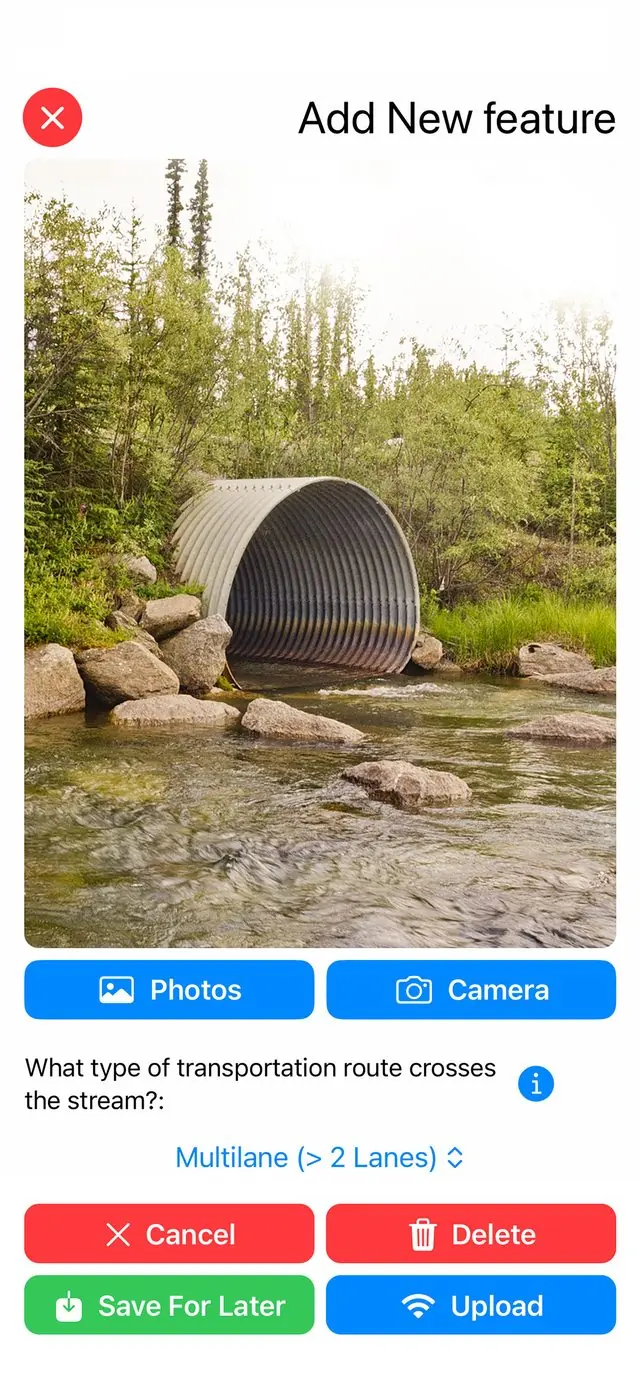
Add a photo. The location is captured automatically.
Why we built it
Keep scrolling
“CANFISHPASS turns every user into a community scientist and empowers Canadians to directly contribute to freshwater connectivity restoration efforts. … Every observation through CANFISHPASS improves our national understanding of freshwater connectivity and helps to ensure practitioners and decision makers have access to the best available information to confidently take meaningful action to replace problematic structures with nature-based designs to increase the resiliency of both infrastructure and ecosystems.”
Nick Mazany-WrightSenior Spatial Ecologist, Canadian Wildlife Federation
Fish need to move.
Fish and other aquatic species travel through Canada’s rivers in search of food, suitable habitat, and the conditions they need to survive. Some travel a few hundred metres; others cover hundreds of kilometres to complete a single life cycle. Those journeys are only possible when our waterways stay connected.
Structures get in the way.
An aquatic barrier is any structure that prevents fish and other aquatic species from moving freely through a river. Dams and weirs are the obvious examples. But the most common barrier in Canada is the culvert: the pipe that carries a stream beneath a road, rail line or trail. Most were built to move water, not fish.
Even if a river looks perfectly healthy, it can still be a dead end.
A barrier beneath a road or railway quietly prevents fish from reaching the habitat they depend on.
Those journeys are only possible when our waterways stay connected.
What we already knowWhat we don’t know
Keep scrolling
We built the Canadian Aquatic Barriers Database.
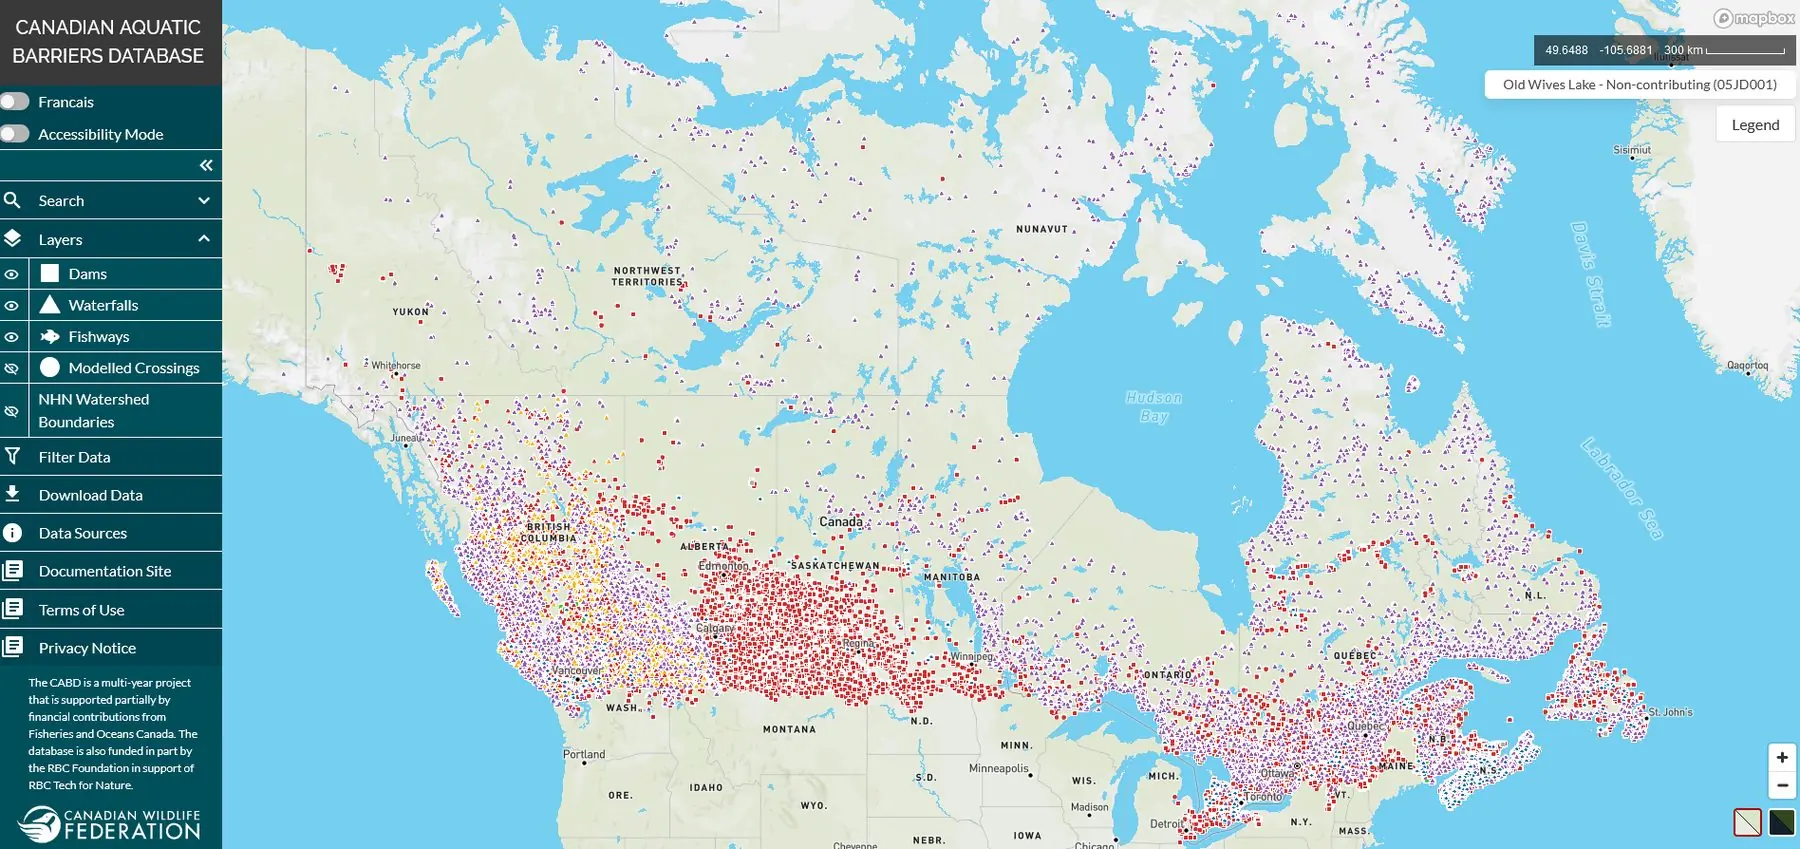
The CABD is the most comprehensive aquatic barrier inventory in Canada, compiled from over 800 existing data sources.
WeirsLow structures that can still be impossible to pass
CulvertsThe most common barrier in Canada
DamsThe most visible barriers
Our work has mapped the following potential barriers:
1,500,000+
stream crossings
36,000+
dams and associated structures
25,000+
waterfalls
We estimate that about 350,000 of those crossings may be blocking fish from reaching critical spawning and rearing habitat.
Many of those 1.5 million stream crossings are modelled, generated automatically wherever a mapped road crosses a mapped stream. They tell us where a barrier might be, not whether it actually exists in the field or whether fish can get through.
Confirming a barrier means going to it. And with hundreds of thousands of potential barriers spread across the country, we can’t do this alone.
The app tells us where to look for barriers, but your assessment tells us what’s really there.
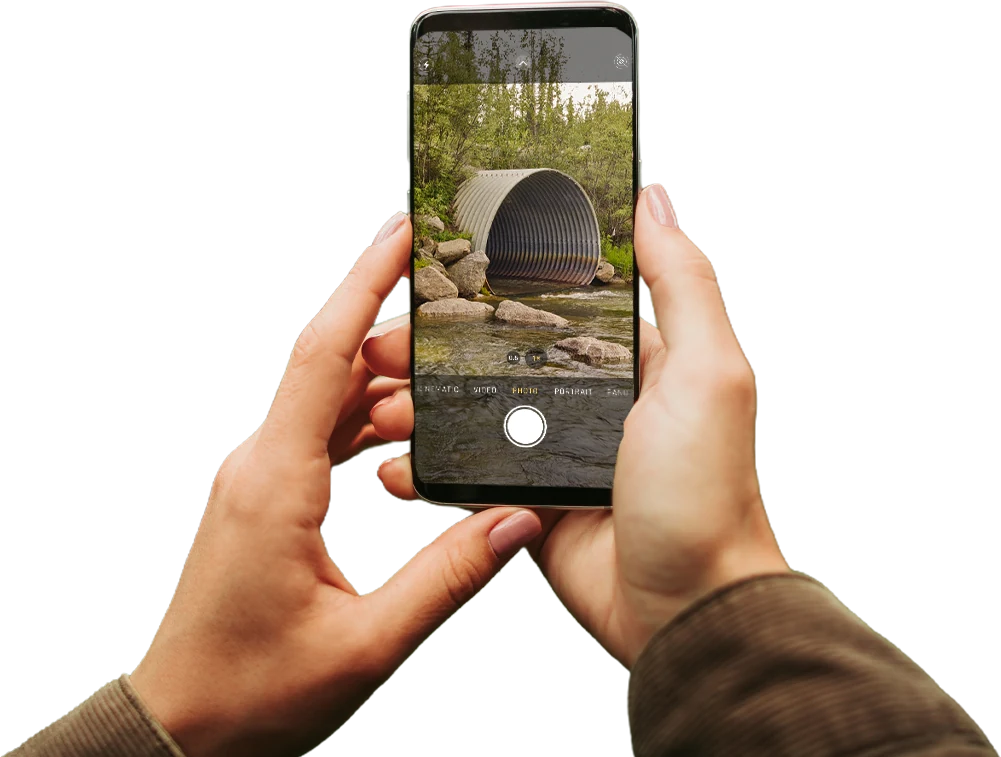
A photograph of two hands holding a phone: the culvert photo is being taken in the CANFISHPASS app, in the field.
Stream crossing · culvert50.7218° N · 120.3644° WStatus: Unassessed
What aquatic barriers look like
DamsThe most visible barriers, and the ones people picture first.
WeirsLow structures that can still be impossible to pass.
CulvertsThe most common barrier in Canada, and the easiest to walk past.
Your part
How your assessment helps
Four things happen every time you upload.
01
ConfirmsThat a dam or stream crossing exists, and identifies structures nobody has mapped.
02
DocumentsThe structure, with photos and basic details including what type it is.
03
Broadly assessesWhether it’s a barrier to passage for fish and other aquatic species.
04
Raises awarenessOf what aquatic barriers do to freshwater ecosystems.
Why it’s worth doing
The challenge is figuring out which ones are doing real harm.
Not every barrier needs to come out. Some don’t disconnect important habitats; some are passable to most fish most of the time. The challenge is figuring out which ones are doing real harm. That’s a question better field data can help answer.
Here’s the encouraging part:
5–10barriers fixed
50%+of habitat reconnected
Within a single watershed, removing or modifying the right 5 to 10 barriers can reconnect more than half of the available fish habitat.
Better data lets practitioners and decision makers act with confidence, replacing problematic structures with nature-based designs that increase the resiliency of both our infrastructure and our ecosystems.
Who it’s for
If you spend time near water, you can contribute.
The stream behind your neighbourhood is part of a freshwater system that spans the country, and a five-minute observation links the two.
No specialized training or equipment is required. Anyone can use it:
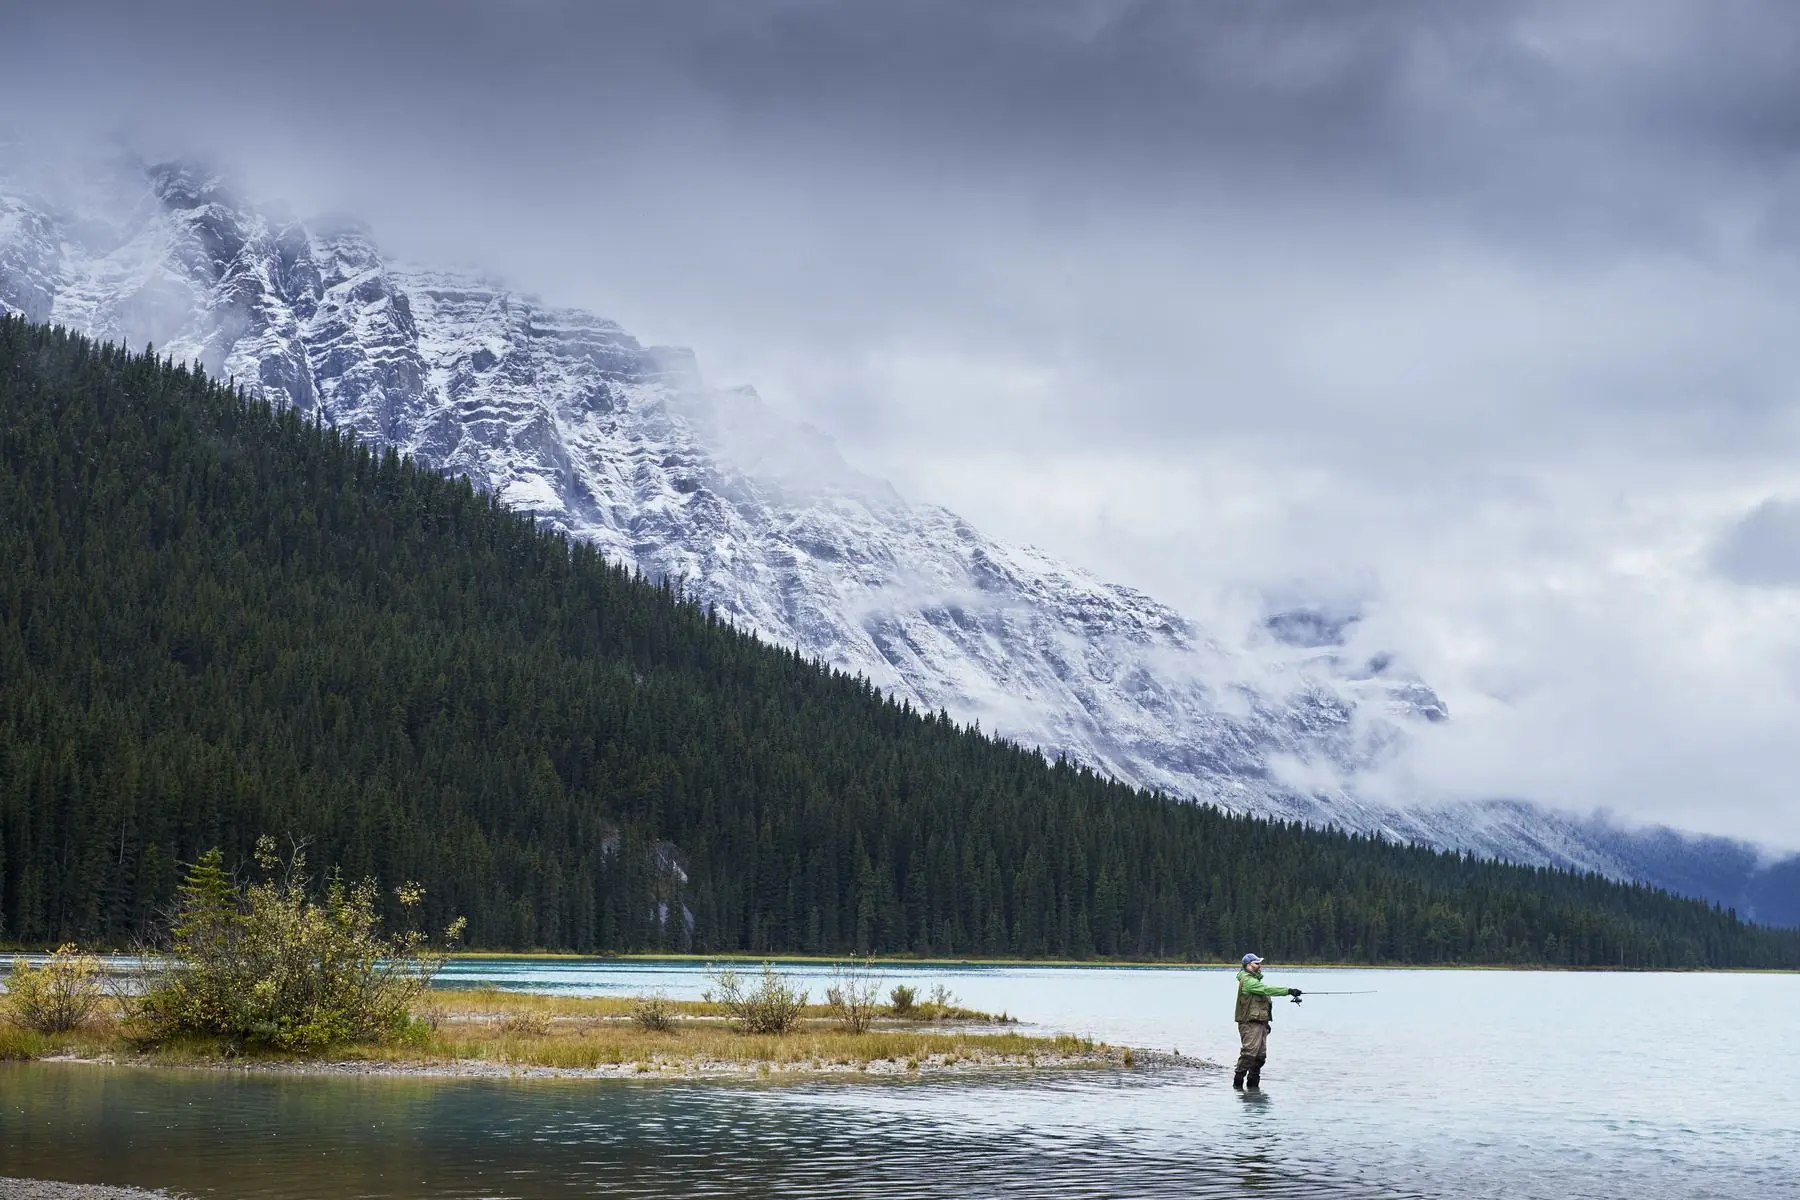
Anglers and fly fishersYou already know where fish stop showing up
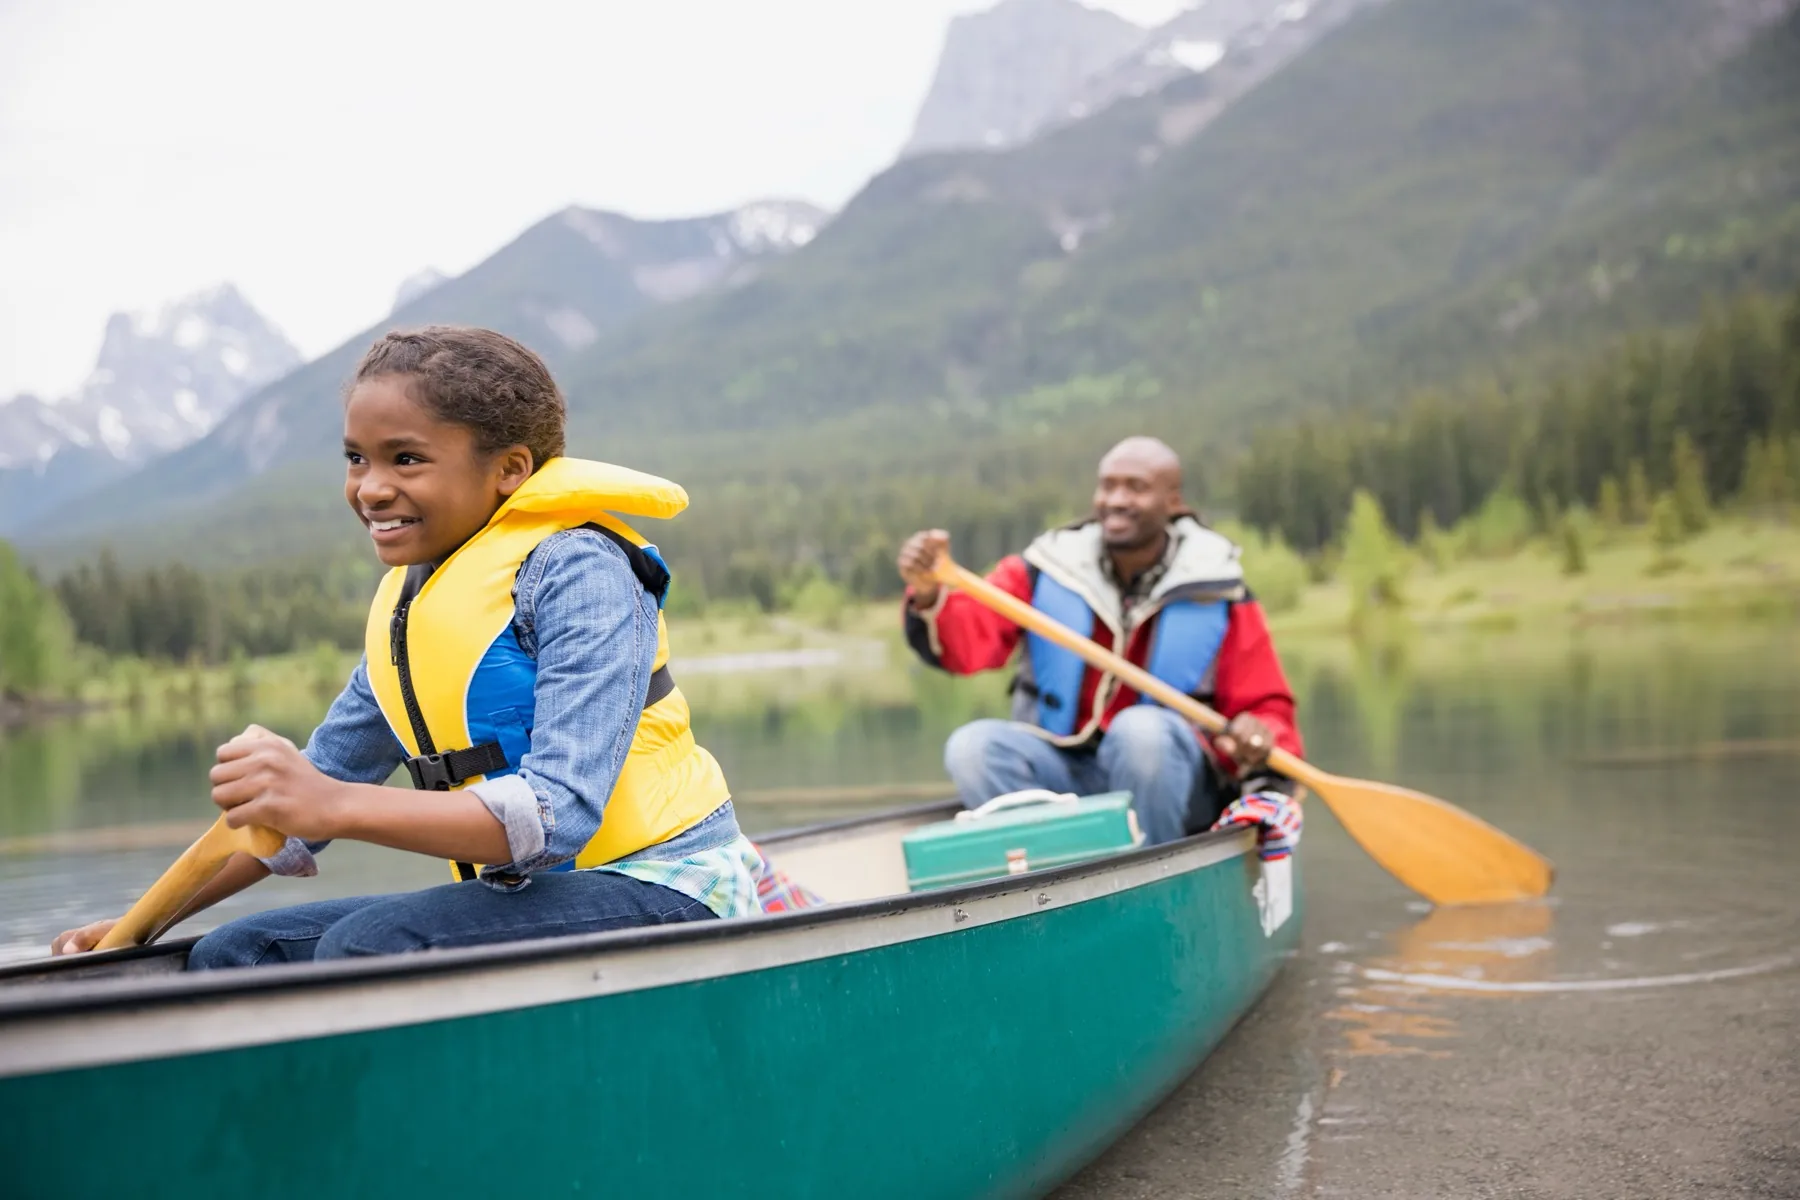
PaddlersIf you’ve portaged around it, you’ve found it
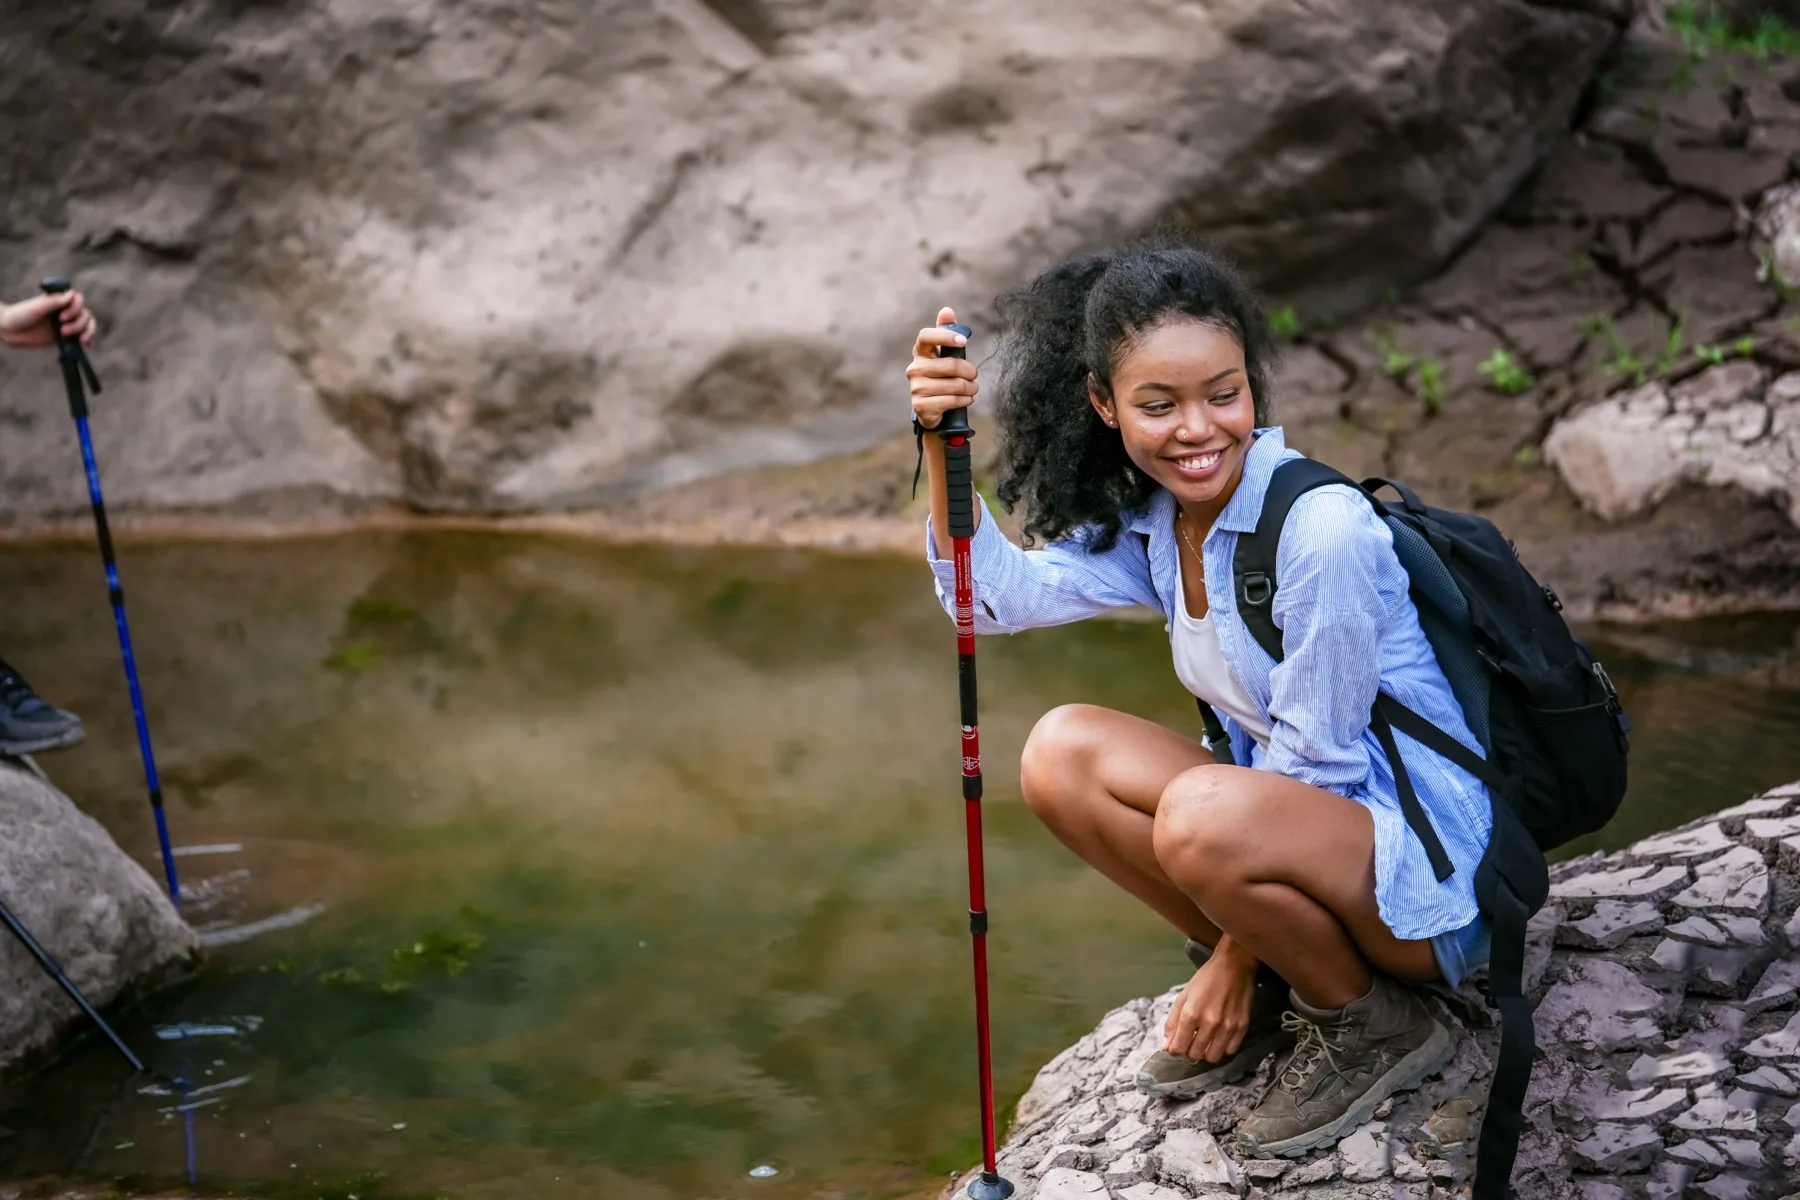
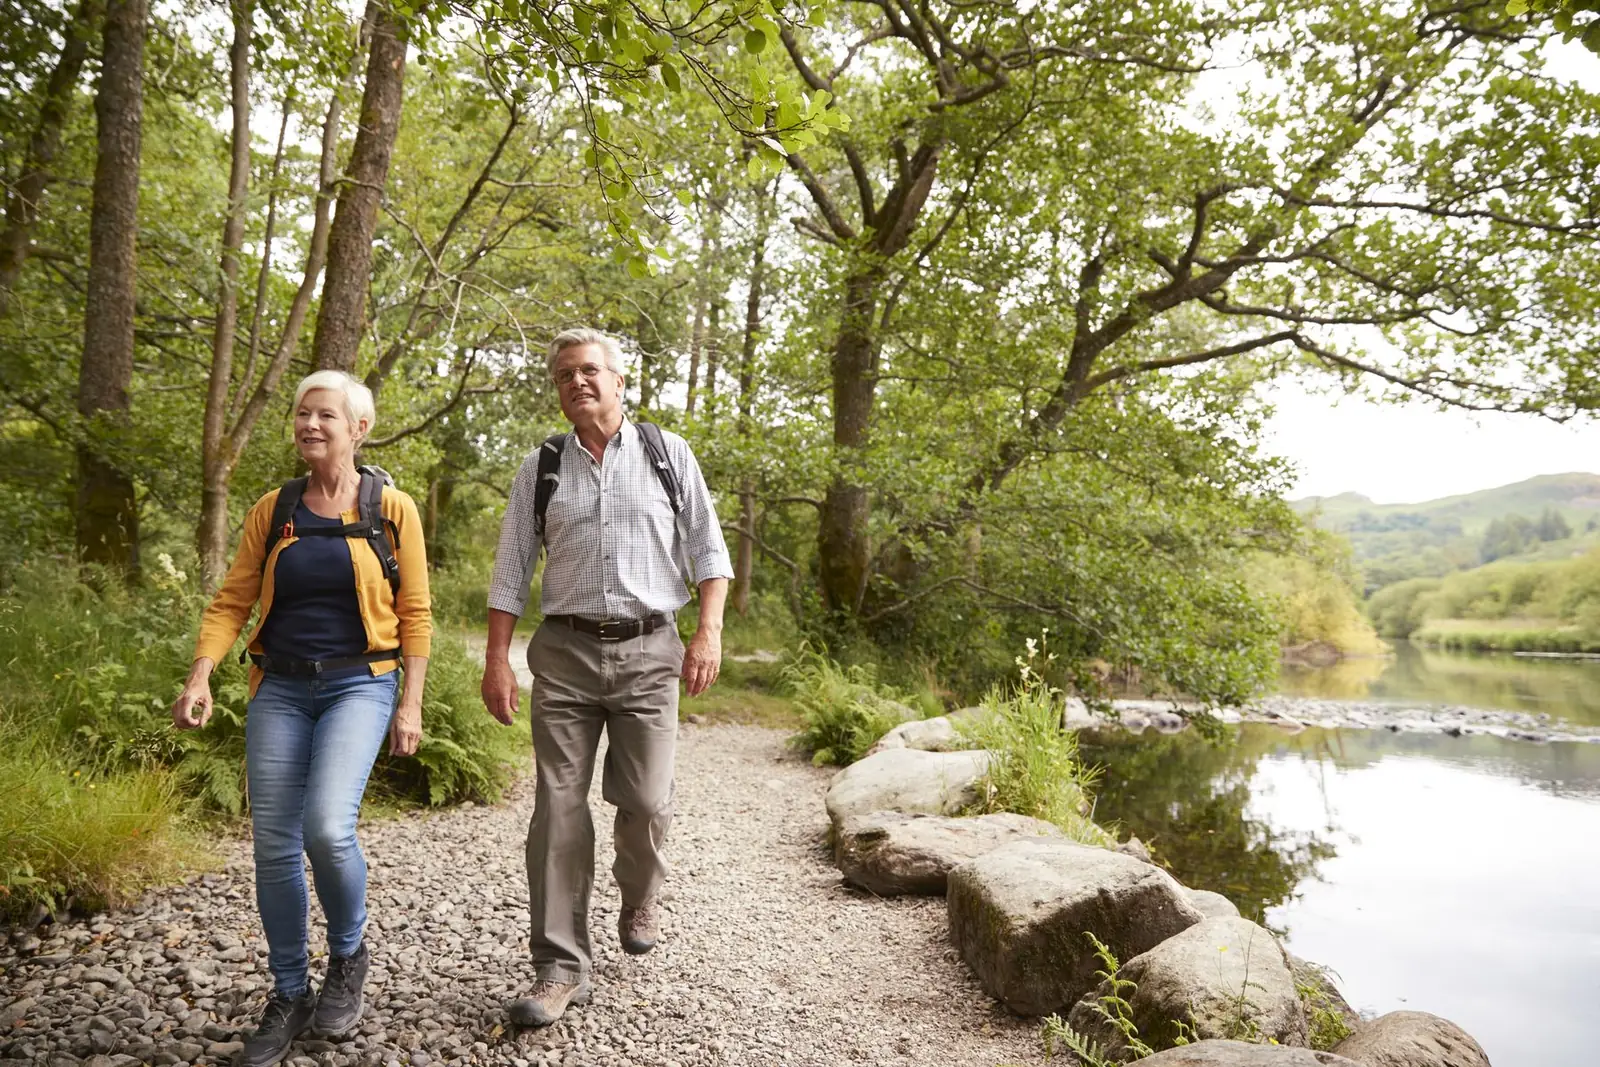
Hikers and trail usersTrails cross streams constantly
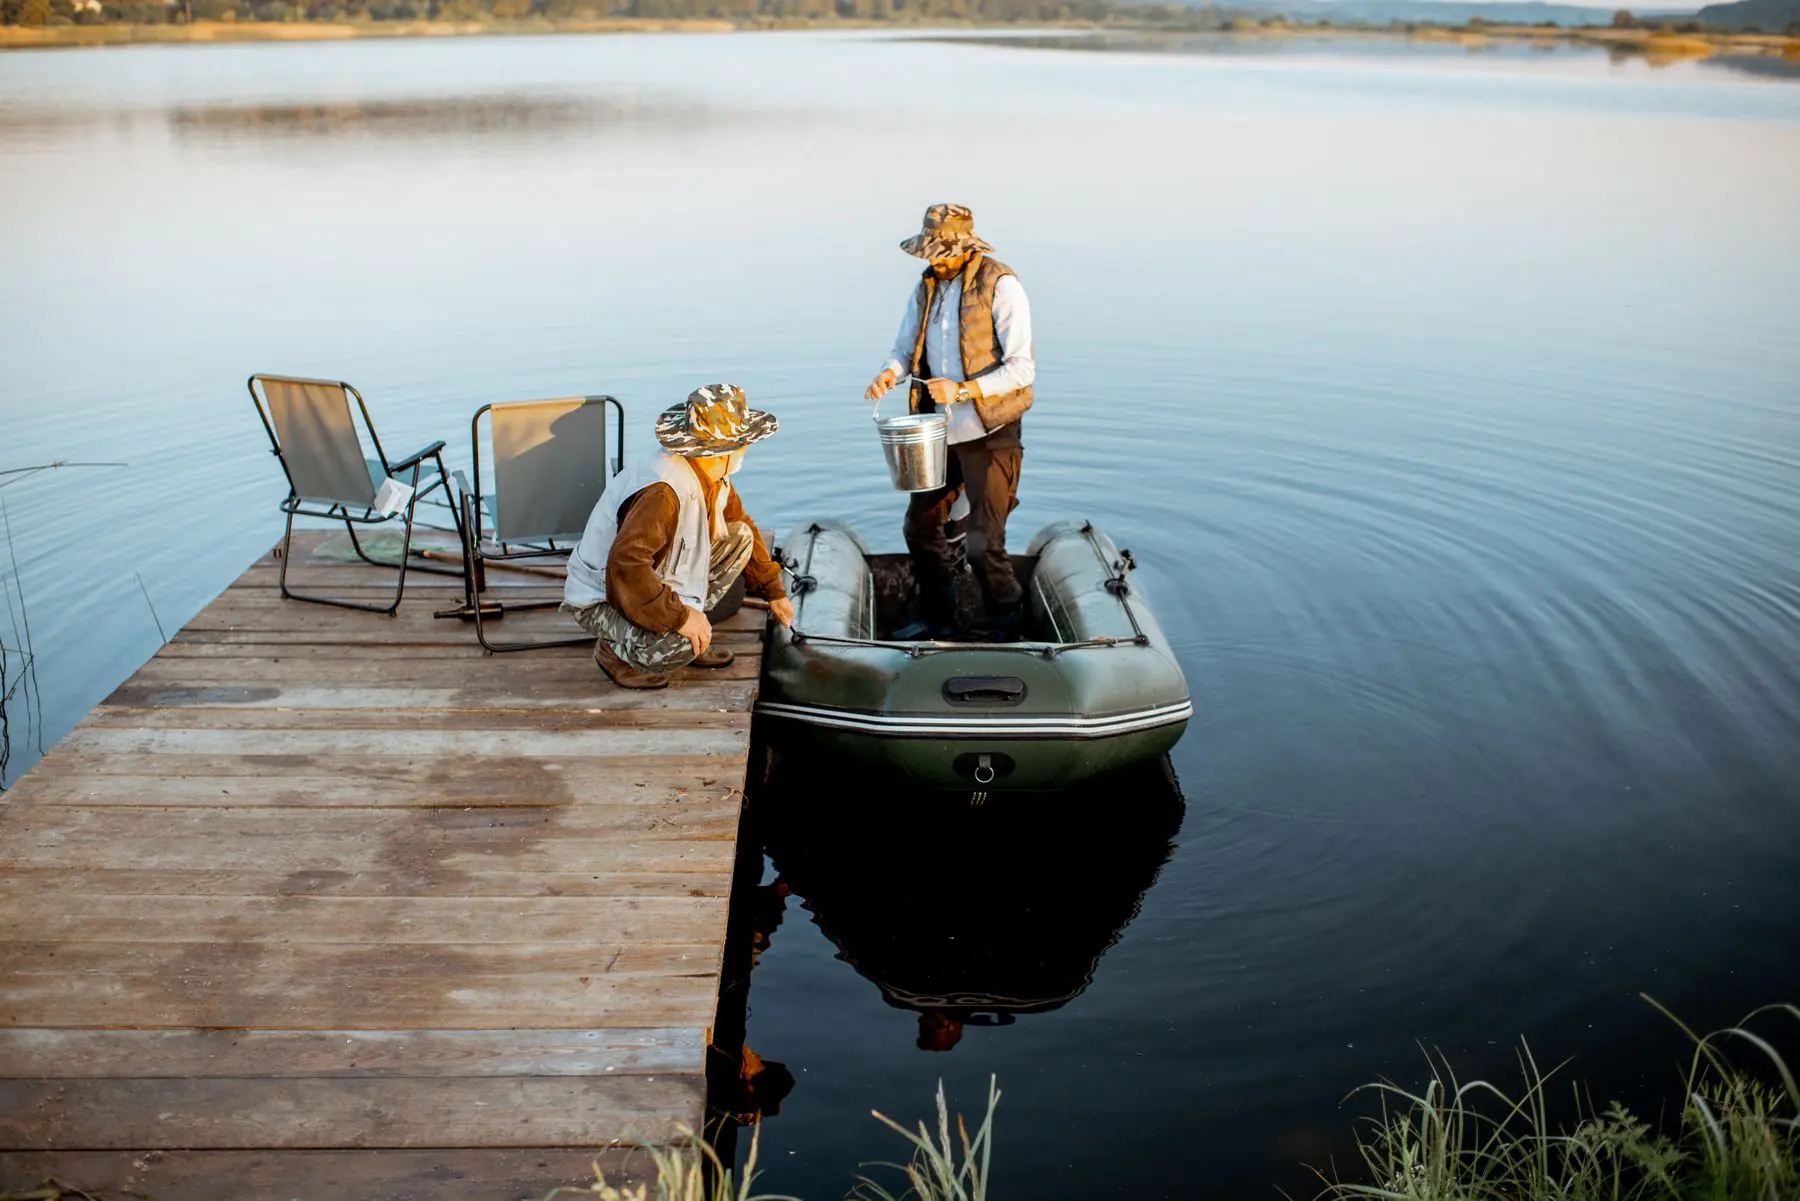
Cottagers and lake associationsYou see the same inlet season after season
Anyone out for a walkMost crossings sit under an ordinary road
In the field
It’s especially useful if you’re already in the field
01
Watershed organizations, Riverkeeper members and restoration practitionersAlready produce exactly this data as part of their work. Logged here, it informs restoration planning nationally, not just locally.
02
Field biologists and conservation authority staffAdd documented methodology, so the record is usable by everyone working on connectivity.
03
Municipal road crews, drainage engineers and inspection teamsAlready out there, and reach remote crossings that survey teams rarely get to. Five minutes at a culvert makes a difference.
04
Researchers and educatorsCan both draw on the dataset and add to it. A field trip that contributes to a national database rather than simulating one.
The CABD is already used by
Fisheries and Oceans Canada
Environment and Climate Change Canada
Natural Resources Canada
Government of British Columbia
Nature Conservancy of Canada
Community watershed groups
Indigenous partners
Fisheries and Oceans CanadaEnvironment and Climate Change CanadaNatural Resources CanadaCommunity watershed groupsIndigenous partnersFisheries and Oceans CanadaEnvironment and Climate Change CanadaNatural Resources CanadaCommunity watershed groupsIndigenous partners
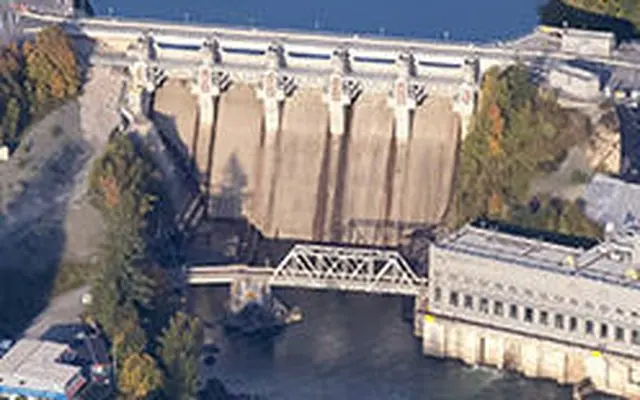 DamsThe most visible barriers, and the ones people picture first.
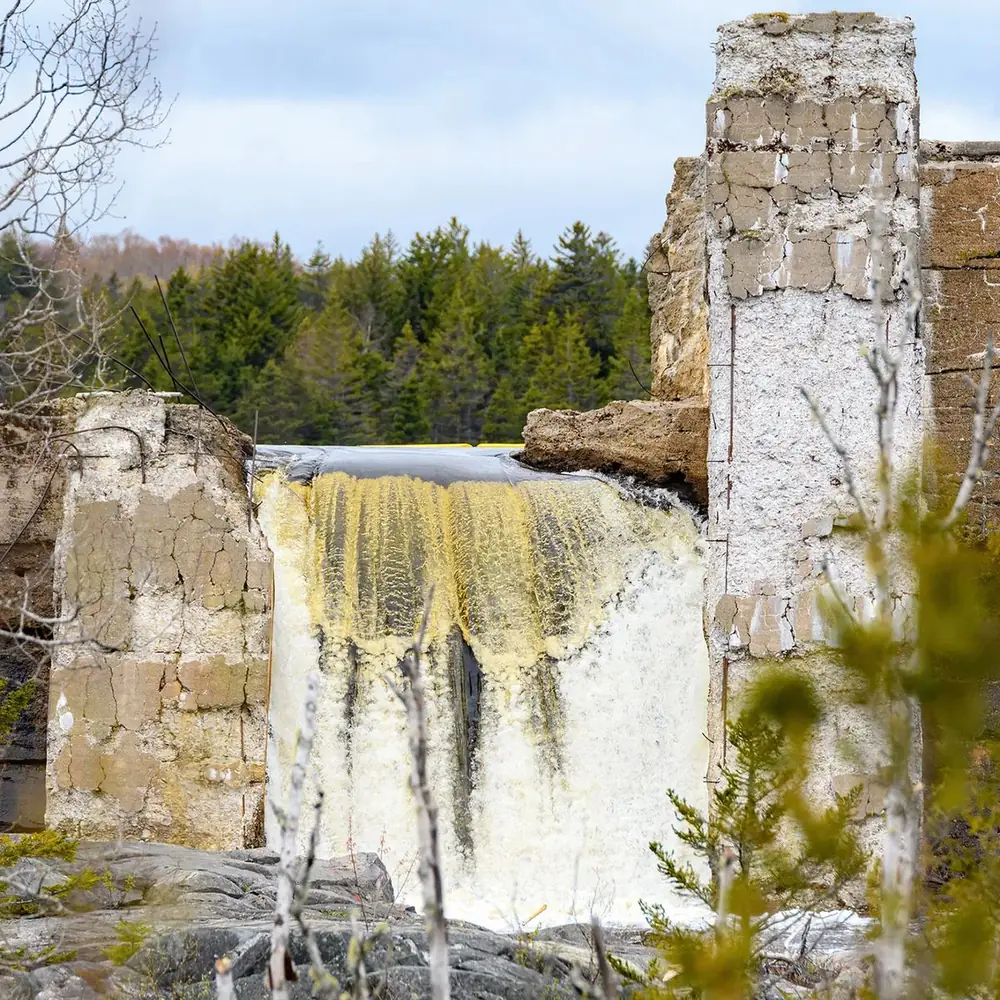 WeirsLow structures that can still be impossible to pass.
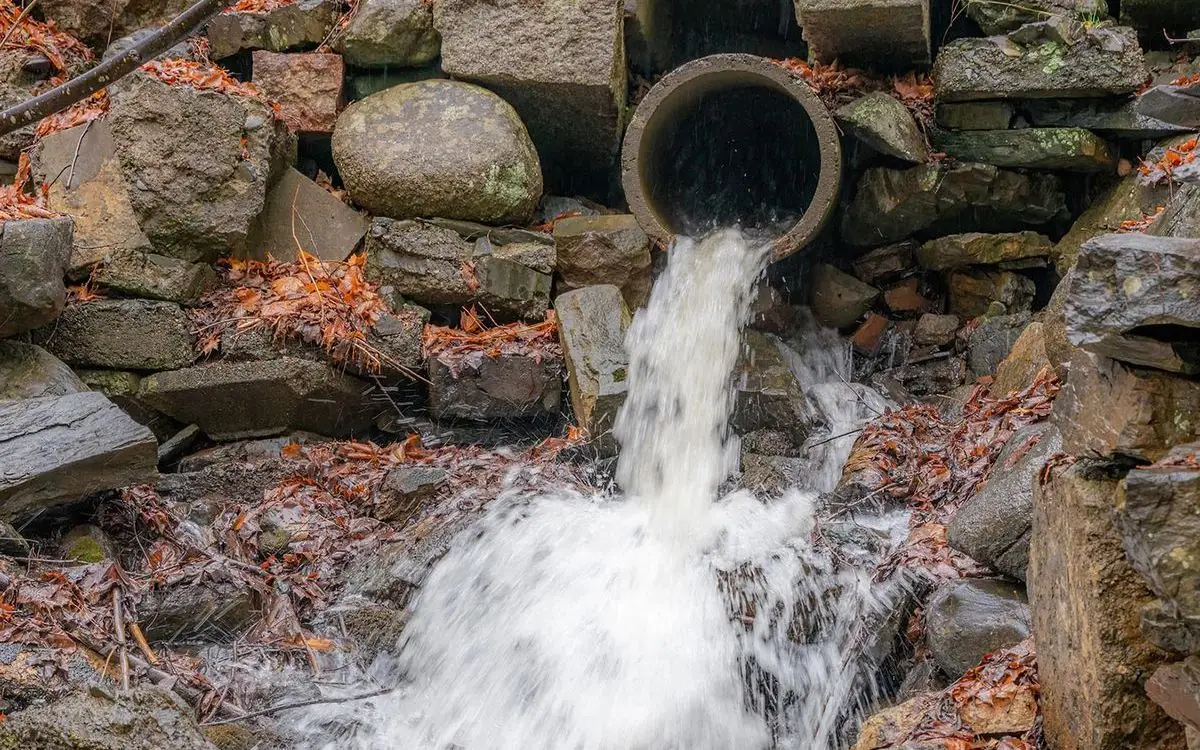 CulvertsThe most common barrier in Canada, and the easiest to walk past.